


Impermanent loss looks a lot like a covered call
Working through impermanent loss with SOL at $30, I realised I had seen that payoff before, in the covered-call vault holding my ETH. The maths: where a liquidity pool and a covered call are the same trade, where they are not, and why concentrated liquidity makes the resemblance stronger.
Today I opened my wallets for the first time since February or March, and the whole market is down as badly as everyone says. While going through my positions, I sat down with impermanent loss properly, using the simplest example I could. Put 100 SOL and 3,000 USDC into a pool while SOL is at $30. If SOL then rallies, you will withdraw fewer than 100 SOL, and you end up with less than if you had simply held. If the price comes back to $30, the gap closes again, which is why the loss is called “impermanent”.
My instinct was that I had seen this payoff before: in Katana, the covered-call vault holding my ETH. Selling upside for income is exactly what a covered call does. I have been providing liquidity on Raydium since last spring and selling covered calls through a vault since the start of this year, so both payoffs are already in my portfolio. This post is my attempt to check the hunch properly: write both payoffs down, put them on one chart, and see where they agree and where they don’t.
How I ended up selling calls
My first contact with options was an airdrop. In April 2021 I read about an airdrop of “KPI options” and had to ask what an option was. In November I put SOL into Chest Finance, a platform that sells call options on deposits, mainly because it might airdrop a token. At the end of December I moved to Katana, with the warning that I should first understand what a covered call is.
Katana won the grand prize at Solana’s IGNITION hackathon last October [1], and its vaults automate one strategy. You deposit an asset, and every week the vault sells call options on it. According to a deep dive published in March, Katana targets a delta of about 0.1, a strike far enough above the price that the option rarely pays out. The options are minted on Zeta and sold to market makers in a Dutch auction every Friday, and deposits roll into the next week automatically [2]. The premium is the yield. What you give up is any rise above the strike: if the price shoots past it, your asset is effectively sold at the strike price. I put a small amount of ETH into its ETH vault at the start of the year and have left it there since.
What impermanent loss is
A constant-product pool such as Uniswap v2, or Orca’s and Raydium’s standard pools, holds reserves x of one token and y of the other and only accepts trades that keep their product constant [3]:
Here P is the pool’s price of SOL in USDC. Whenever the pool’s price drifts from the market’s, arbitrageurs trade against it until the two match again, and they profit from doing so [4]. So at any market price P, the pool’s reserves are pinned down by the two equations above, and so is the value of the position:
In this example, k = 100 × 3,000 = 300,000, and the position is worth 2√(300,000 × 30) = $6,000 at the start, as it should be. Simply holding the same 100 SOL and 3,000 USDC is worth 100P + 3,000. Divide one by the other, write r for the ratio of the new price to the price at deposit, and the loss relative to holding is a function of r alone [4]:
| SOL price moves | From $30 to | Loss vs holding |
|---|---|---|
| −75% | $7.50 | −20.0% |
| −50% | $15 | −5.7% |
| −25% | $22.50 | −1.0% |
| +25% | $37.50 | −0.6% |
| +50% | $45 | −2.0% |
| +100% | $60 | −5.7% |
| +300% | $120 | −20.0% |
The common rule of thumb, that a 100% move costs about 5%, is close: it is 5.7%. Two things in the table matter for what follows. First, the loss is never positive. The pool is behind holding at every price except the one you deposited at. Second, the loss is symmetric in a strange way: a halving costs exactly as much as a doubling.
I also don’t love the name. The loss is only “impermanent” if the price comes back before you withdraw, and nothing guarantees that. Pintail, who analysed it for Uniswap in early 2019, renamed it “divergence loss” in 2020 for exactly that reason [4].
Putting the two payoffs side by side
A covered call on the same position keeps the 100 SOL and 3,000 USDC and sells, for a premium c per SOL, the right to buy the SOL at a strike K when the option expires. At expiry the position is worth:
To compare like with like, I picked a one-week call at K = $36, 20% above the price, roughly the kind of strike Katana sells. At 100% annualised volatility, a round number for SOL, the Black–Scholes formula [5] gives it a delta of 0.1 and a price of about $0.20, so the vault collects about $20 on 100 SOL for the week. The chart below adds a third line, which I come back to in the next section.
The chart supports my hunch, but only half of it, and the details are the interesting part.
First, both positions lose to holding when SOL rallies hard. That is the shared shape I noticed: the covered call gives up everything above $36, and the pool gives up a growing share of the rally as it sells SOL on the way up. Both have sold their upside to someone else.
Second, below the strike they are opposites. The covered call is holding plus the premium: it is $20 ahead whether SOL goes to $33 or to $15. The pool is behind at every price, and it keeps buying SOL as SOL falls, so it is $257 behind at $15. A covered call caps the upside and leaves the downside unchanged. A pool gives up a little on both sides.
Third, my first instinct was that the consequences are about the same, but that the AMM should eat bigger gains and bigger losses. That was half right. Against the covered call, the pool does lose more when the price falls or barely moves, and it does keep more when the price runs, since it overtakes the call just above $36.50. Against simple holding, though, the pool has no bigger gains at all. It is just a gentler version of the same trade.
That trade has a name. Joseph Clark showed in 2020 that a constant-product position can be replicated by a portfolio of options, and that it is structurally short volatility, which is why liquidity providers need trading fees to be paid for it [6]. Angeris, Evans and Chitra went further last year: for a broad class of payoffs, you can design an automated market maker whose liquidity position reproduces the payoff [7]. A covered call and a pool are two members of the same family, both short volatility. They differ in how the seller gets paid. A covered call is paid in advance, a premium set by professional market makers at auction. A pool is paid afterwards, in fees, by whoever happens to trade with it.
Concentrated liquidity turns a pool into a call
The dashed line is concentrated liquidity. Orca launched Whirlpools in March [8]. Like Uniswap v3, a Whirlpool lets a liquidity provider choose a price range [Pa, Pb] instead of providing liquidity from zero to infinity. Inside the range, a position with liquidity L holds [9]:
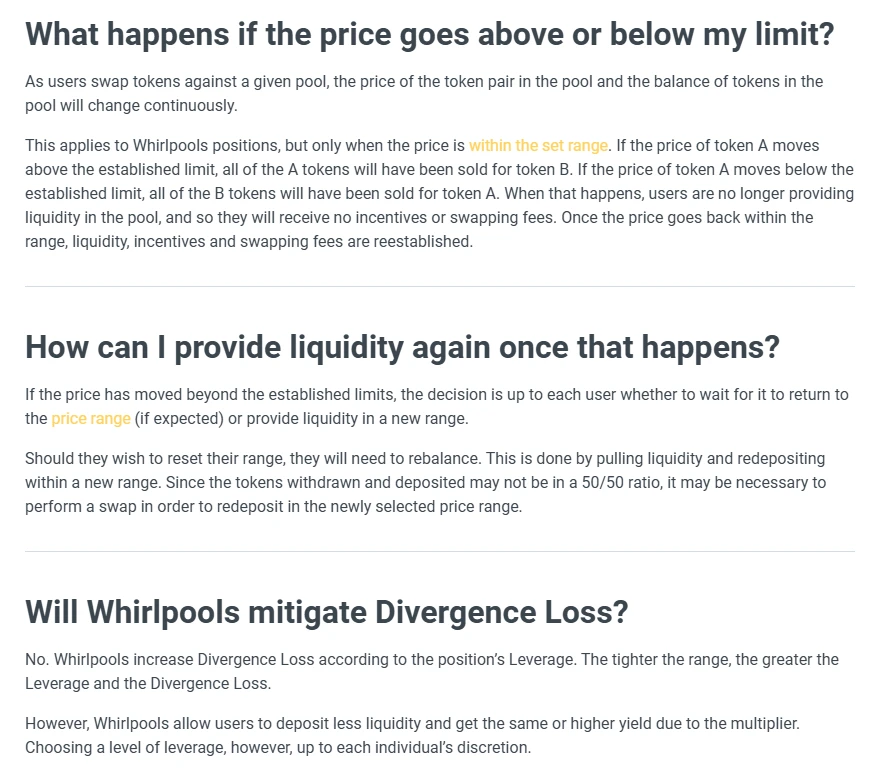
Above Pb, x is zero: every SOL has been sold, and the position is worth a fixed amount of USDC however far the price rises. That flat line is a covered call’s payoff above its strike. Guillaume Lambert made the point last June: a Uniswap v3 position squeezed into a single tick above the price behaves like a covered call with no expiry date, a “perpetual” covered call [10]. Orca’s own documentation doesn’t hide the cost. If the price leaves the range, “all of the A tokens will have been sold for token B”, and Whirlpools do not reduce divergence loss: “The tighter the range, the greater the Leverage and the Divergence Loss” [11].
That is what the dashed line shows. With the same $6,000 in a $25–36 range, the position is flat above $36 like the call, but $314 behind holding there instead of $20 ahead. Below $25 it is all SOL, more SOL than I would have held, so it is $1,357 behind at $15. The concentrated position makes the same bet as the pool with leverage, in exchange for a larger share of the fees while the price stays inside the range. A tighter range sells the rally sooner, and the chart shows it.
What the chart leaves out
First, time. The covered call settles once a week, on one price. The pool is marked to the current price continuously, and its value depends only on where the price is, not how it got there. A weekly vault, by contrast, sets a new strike every Friday, so after a crash the new strike is lower and a recovery gets capped sooner. Over many weeks, the path matters for the vault in a way it does not for the pool.
Second, who pays. The chart leaves out fees and treats the premium as fixed. In practice, the premium is set by market makers who price volatility for a living, and pool fees come from traders, some of whom are arbitrageurs who trade exactly when the pool’s price is stale. In both cases I am selling volatility to people who probably understand it better than I do. A yield number means little until I know who is on the other side of it.
Third, the legs that are not on the payoff diagram. The “ETH” in a Solana vault is not ETH but a token issued by a bridge. In February, an attacker fraudulently minted 120,000 wrapped ETH through the Wormhole bridge, and holders were only made whole because Jump, the trading firm that owns Wormhole’s main developer, replaced the 120,000 ETH [12]. No option formula prices that risk.
What I’m doing with my ETH
The other option on my screen today is stETH, Lido’s staked ETH, which the market is selling at a discount this month. Holders cannot redeem it for ETH until after the Merge [13], and funds that need liquidity now are selling. The discount reached a record 8% on 13 June [14], and on my screen today it is about $40 below ETH, around 4%.
So I have two ways to earn on the same asset. The Katana vault sells upside for a premium every week. stETH earns staking rewards, and buying it at a discount is a bet that the discount closes once withdrawals open. I am going to split the ETH between the two and treat it as a controlled experiment. I would rather learn how these two payoffs behave with a small amount of money than read about them.
The main thing I learned today: an LP position and a covered call are both ways of selling volatility. The pool sells it continuously and is paid in fees. The vault sells it once a week and is paid in premium. For any yield from now on, I want to know what I have sold, and to whom.
References
- Solana Foundation. Meet the winners of Solana IGNITION. 29 October 2021. solana.com.
- Sitesh Kumar Sahoo. How to Katana: the yield machine on Solana, a deep dive. Medium, 24 March 2022. insitesh.medium.com.
- Hayden Adams, Noah Zinsmeister and Dan Robinson. Uniswap v2 Core. March 2020. PDF.
- Pintail. Uniswap: a good deal for liquidity providers? Medium, 12 January 2019, updated 30 August 2020. pintail.medium.com.
- Fischer Black and Myron Scholes. The pricing of options and corporate liabilities. Journal of Political Economy 81(3), 637–654, 1973. doi:10.1086/260062.
- Joseph Clark. The replicating portfolio of a constant product market. SSRN, 8 March 2020. ssrn.com/abstract=3550601.
- Guillermo Angeris, Alex Evans and Tarun Chitra. Replicating market makers. March 2021. arXiv:2103.14769.
- Orca. Introducing Whirlpools: concentrated liquidity on Orca. Medium, 17 March 2022. medium.com/orca-so.
- Hayden Adams, Noah Zinsmeister, Moody Salem, River Keefer and Dan Robinson. Uniswap v3 Core, equations 6.29 and 6.30. March 2021. PDF.
- Guillaume Lambert. Uniswap v3 LP tokens as perpetual put and call options. Medium, 23 June 2021. lambert-guillaume.medium.com.
- Orca. Whirlpools FAQs. Orca documentation. Archived copy: 4 May 2022.
- Andrew Thurman. Jump Trading backstops Wormhole's $320M exploit loss. CoinDesk, 3 February 2022. coindesk.com.
- Krisztian Sandor. Staked ether discount after Terra collapse a sign of liquidity crunch in crypto. CoinDesk, 2 June 2022. coindesk.com.
- Krisztian Sandor. 'Staked ether' becomes focus of crypto stress, from Celsius to Three Arrows. CoinDesk, 14 June 2022. coindesk.com.